
Raluca Nicola
Web cartographer with an interest in 3D and data visualization. I work as a Product Engineer with the ArcGIS API for JavaScript team at Esri.
 I'm currently based in Zurich Area, Switzerland.
WORK


Women in space - A visualization of all the women that travelled to space until 2021
March 2021, Github

Ridgeline terrain - Interactive ridgeline plots for displaying elevation in Switzerland.
July 2020, Github

Low poly ski resort map - A touristic map of Mammoth ski resort, California. The map uses a low poly style.
April 2020, Github

Zurich in contour lines - A terrain visualization of Zurich using contour lines.
December 2019, Github


Earthquake visualization - This visualization displays earthquakes with exaggerated depth. The color and size of each earthquake is mapped to their magnitude.
December 2019, Github


The colors of Romania - A map that shows european election results in Romania.
September 2019, Github

Old Zurich in photos - Displays georeferenced photos from the ETH archive on a 3D map.
August 2018, Github

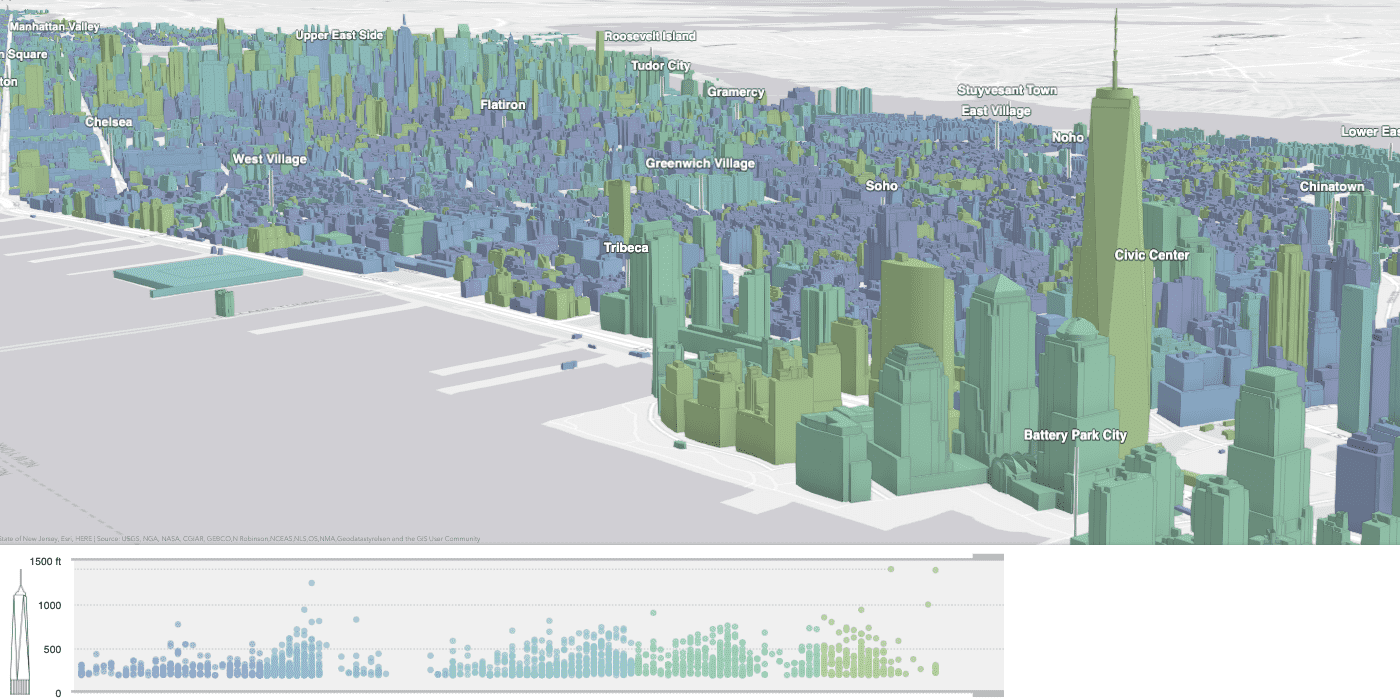
Manhattan Skyscraper Explorer - In this 3D web map users can explore the highest buildings in Manhattan.
July 2017, Github
BLOG
- A student's guide to jobs in GIS and cartography April 4, 2020
- The colors of Romania October 19, 2019
- Web programming for cartographers November 14, 2018
Read more of my blog posts on the Esri ArcGIS Blog.
TALKS
- Web Cartography Unfolded: the Technology behind Web Maps - Front Conference Zurich, August 2021.
- ArcGIS API for JavaScript: 3D visualization - Esri Developer Summit, April 2021. video
- Explorations in 3D Web Cartography - NACIS Annual Meeting, October 2020. video
- ArcGIS API for JavaScript: A Holistic Approach to Building 3D Web Apps - Esri Developer Summit, April 2020. video
- ArcGIS API for JavaScript: Practical Guide for Building a 3D Web App from 2D Data - Esri Developer Summit, April 2020. video
- The web developer's guide to cartography - RevoJS, October 2019. video
- The cartographic side of the web - Web Meetup Zurich, August 2018. video