#Data visualization
10 articles tagged Data visualization.
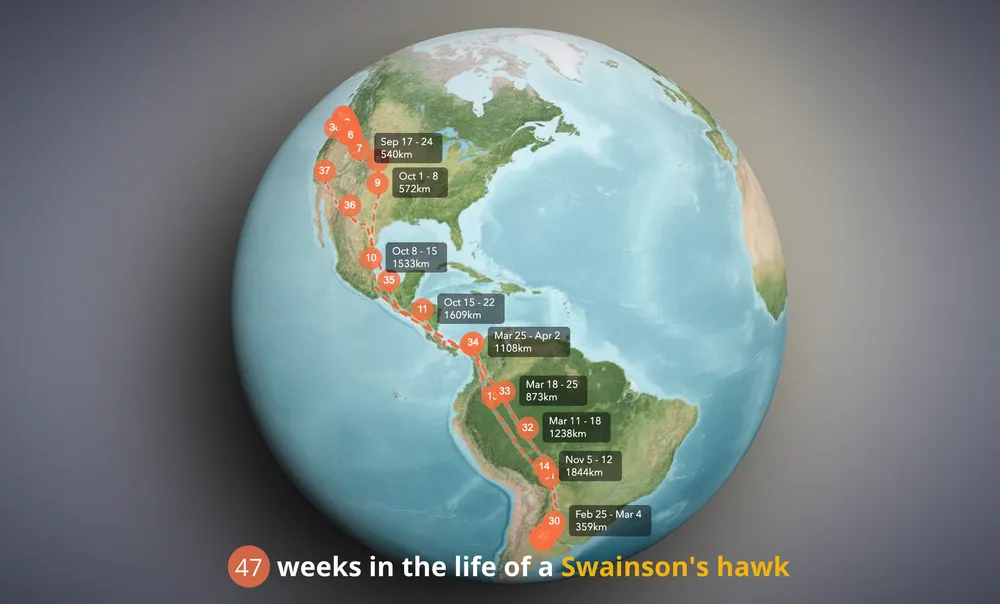
Swainson's Hawk migration
Visualization of Swainson's Hawk migration patterns.
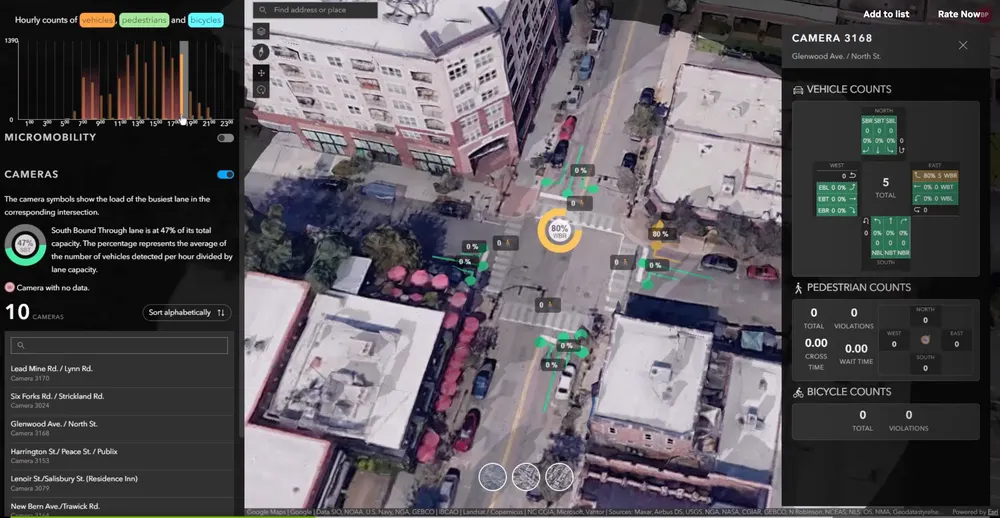
Raleigh in Motion
A dashboard to explore real-time and historical traffic in Raleigh, North Carolina.
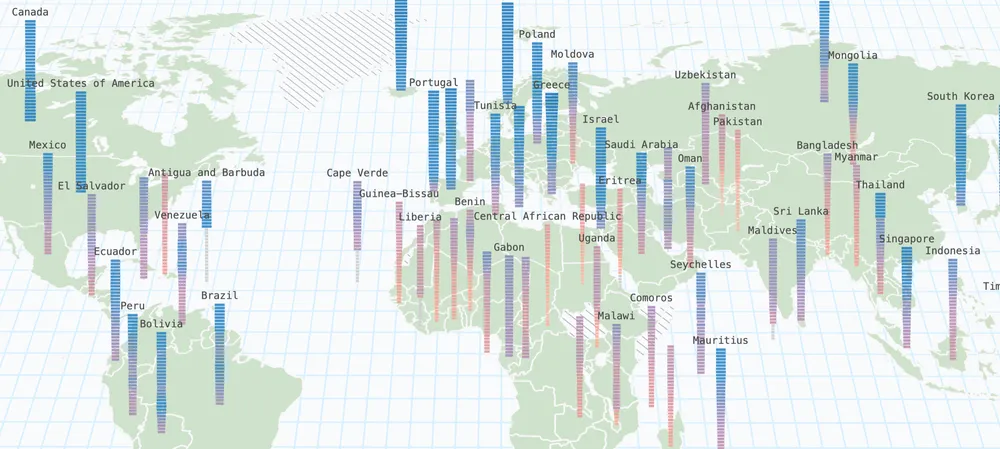
Better access to education for children
Children stay longer in school compared to 30 years ago.
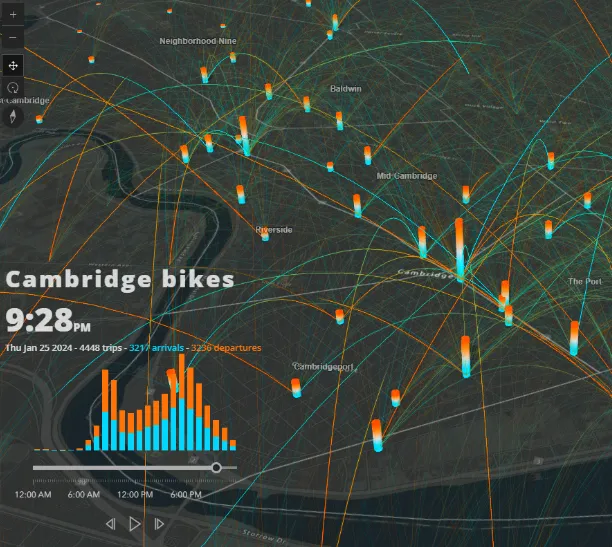
Blue Bikes open data
Visualization of Blue bikes data in Cambridge in January.
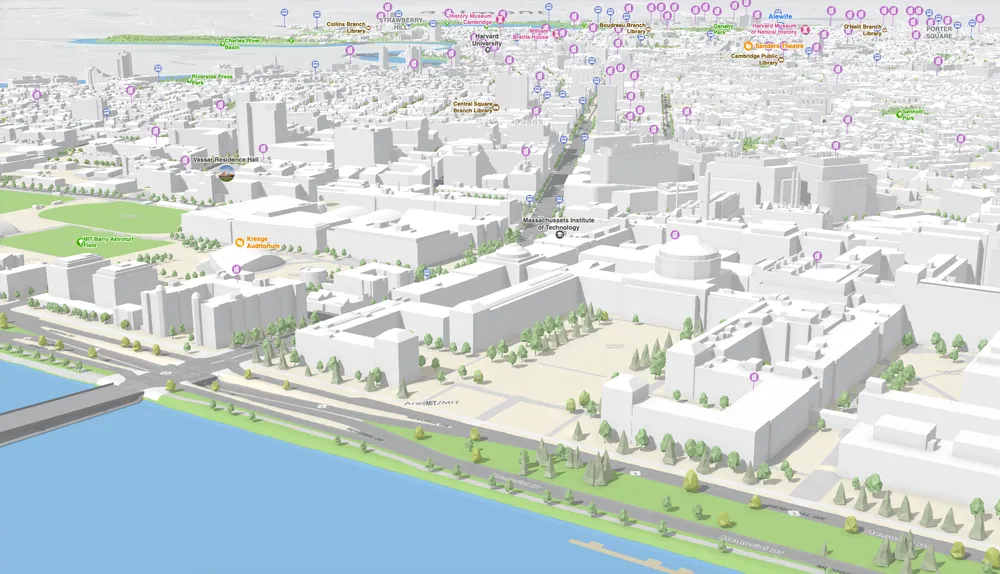
Cambridge - basemaps
Creating basemaps for the city of Cambridge using open data.
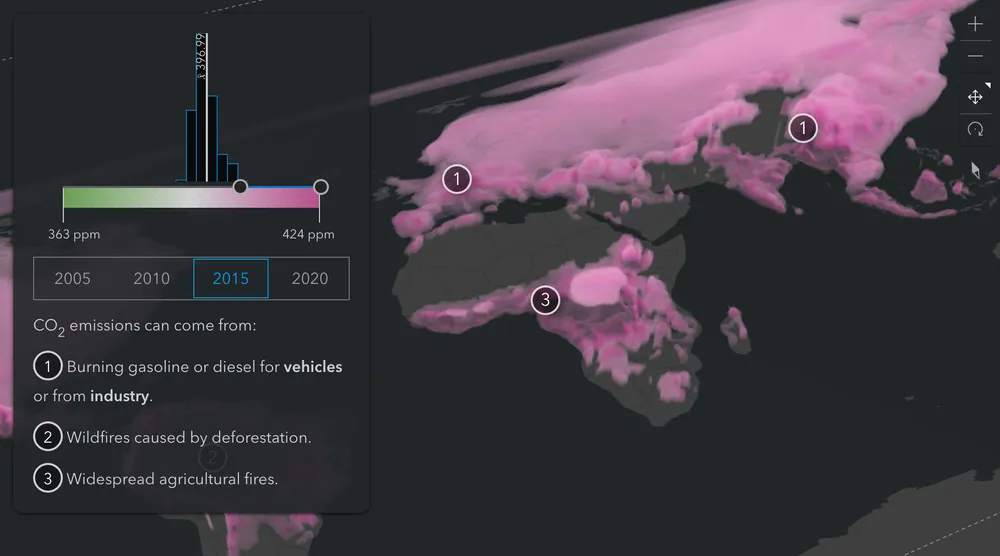
Global carbon dioxide
A voxel visualization of the global distribution of carbon dioxide in the atmosphere.

Satellite Explorer
An educational tool to explore satellites in orbit around the Earth.
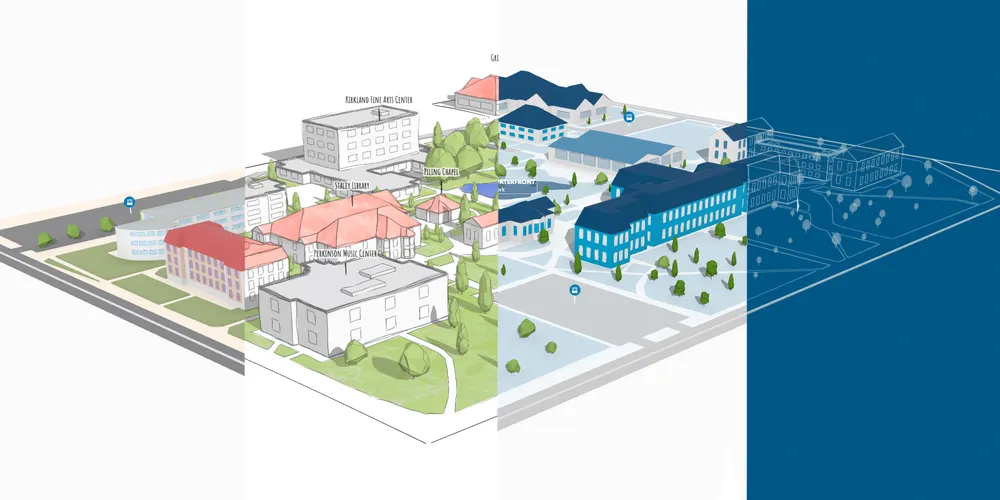
Campus maps styles
Experiments with several styles for campus maps.
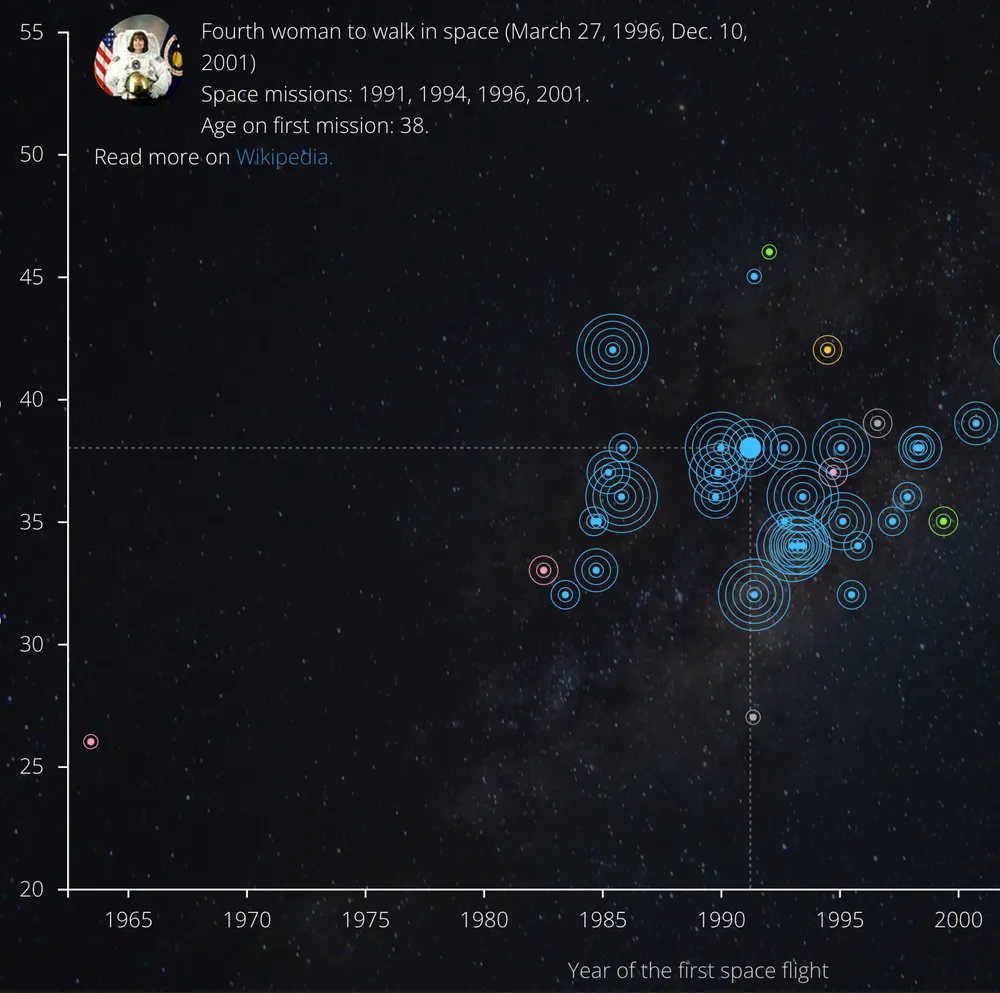
Women in space
An interactive chart providing insights into the history of women that travelled into space.
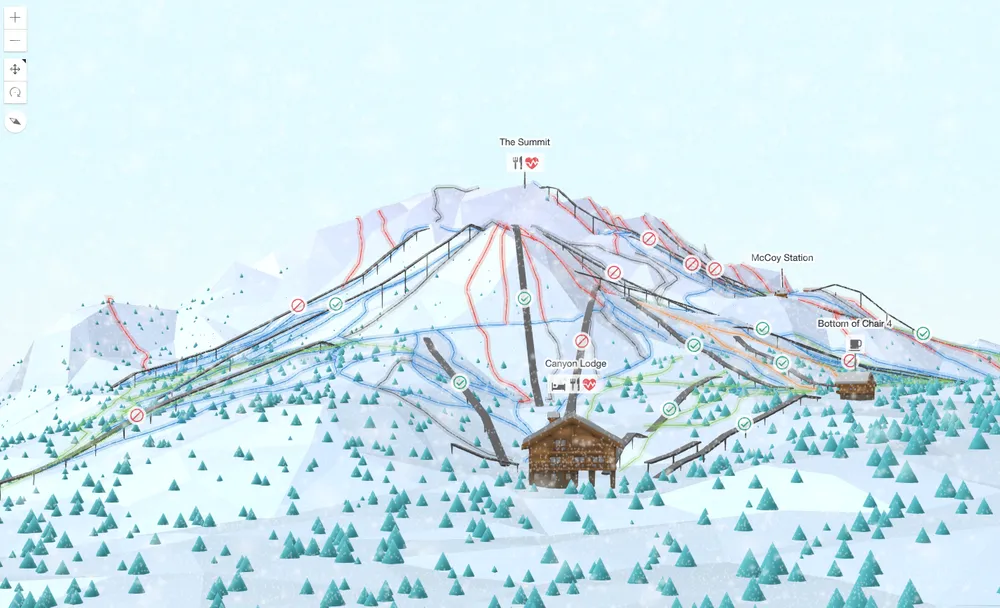
Ski map Mammoth
An interactive low poly map of Mammoth ski resort